|
Headlines |
Oct-26 |
Sep-26 |
|
Monthly Index* |
547.8 |
548.1 |
|
Monthly Change* |
-0.0% |
-0.3% |
|
Annual Change |
0.5% |
0.8% |
|
Average Price (not seasonally adjusted) |
£273,566 |
£274,251 |
* Seasonally adjusted figure (note that monthly % changes are revised when seasonal adjustment factors are re-estimated)
Commenting on the figures, Robert Gardner, Nationwide’s Chief Economist, said:
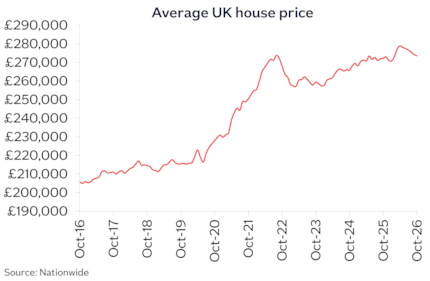
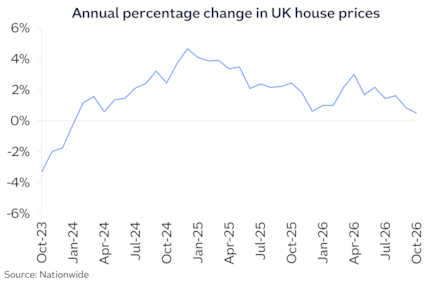
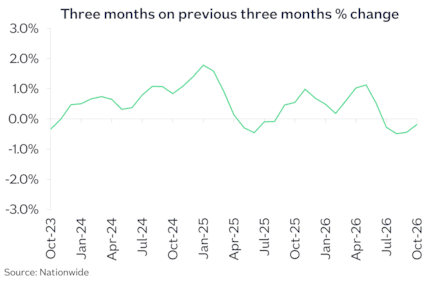
“October saw a further slowing in UK annual house price growth to 0.5%, from 0.8% in September. That is the weakest growth since January 2024. Prices were flat month on month, after taking account of seasonal factors.
“Market activity and house price growth have slowed in recent months, in part reflecting the uncertain economic backdrop. Geopolitical tensions remain high, with the conflict in the Middle East exerting upward pressure on energy prices, fanning inflation concerns.
“This in turn has led to mounting financial market expectations of Bank Rate increases, which have maintained upward pressure on the market interest rates which underpin mortgage pricing.
Where next?
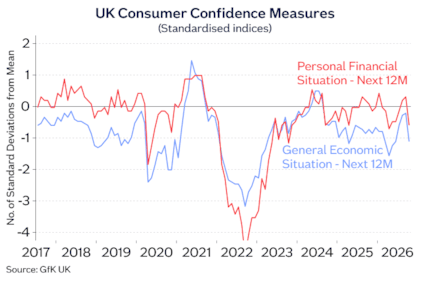
“Forward-looking indicators suggest further softness in the near term. Surveyors report that new buyer enquiries remain weak. Moreover, consumer sentiment dipped noticeably in October, with households becoming less confident about the outlook for the general economy as well as their own financial situation in the year ahead.

“Once the energy shock fades, there are good reasons to believe the market will regain momentum. The broader economy has proven surprisingly resilient to date, with annual economic growth accelerating in recent quarters. Employment is holding up well, as are real incomes, while household balance sheets are solid, with debt levels still close to 20-year lows relative to household disposable income.
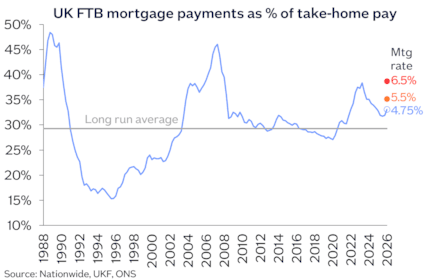
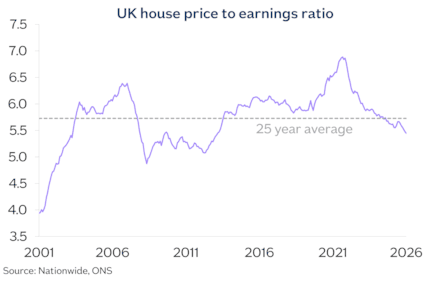
“Moreover, the improvement in housing affordability seen over the past two years has been only partially unwound as a result of higher market interest rates, as income growth has continued to outpace house price growth by a wide margin (see chart below).”

-ends-